- Perfetto is definitely one of my favorite tools to use ever, thank you for working on it!
My personal favorite tool I've built this year is to dynamically generate a trace from a sql query, and allow quickly combining queries. Something like `SELECT timestamp, track, name, ` etc. where column names get transformed to packets automatically.
That way I can overlay multiple py-spy traces and instrumentation into a dynamically implemented generated perfetto trace, loaded into a perfetto iframe using the ping/pong mechanism at https://perfetto.dev/docs/visualization/deep-linking-to-perf....
- Thanks for the nice words! Your tool sounds super neat!
We're look at integrating some sort of similarish things into Perfetto itself where, for a synthetically generated trace, you can say "run this SQL query and add a debug track for it on trace load". See the discussion on https://github.com/google/perfetto/issues/1342 :)
- Perfetto is kind of a weird tool because it seems to be designed around tracing Linux and Android but overwhelmingly it gets used because of their integration with the exceptionally simple JSON tracing format that takes like 2 seconds to implement in whatever tool you are using. This alone is profoundly useful and I greatly respect the impact they have had towards commoditizing "trace viewing". I've gotten so much mileage out of it because of that.
I understand that Google maintains and uses this tool for their own thing but I kind of wonder if the UI should just get split off into its own thing, because I get the impression that they don't even really particularly like supporting what everyone else is using it for. I know the maintainers are around here is around so perhaps they have more context but it's just very strange to me that the UI will always be showing things like "syscall trace" or "connect a device" when I am looking at GPU kernels or network spans. And I get the impression that the JSON format is considered to be kind of grandfathered in and not really what they like supporting. I guess in a sense it's a little weird that most of the people I know use it like the flamegraph viewer tool for traces but it views itself as the one-stop-shop for your Android performance profiling that just happens to have good import for recorded profiles.
Also, I repeat this a lot, but I think a lot of profiling tools could stand to learn things from Apple's Instruments. I don't really know what they are doing over there but their UI is almost always the best for actually finding what the problem is rather than just dumping data at you like what a lot of profiling tools do (especially for Linux). Notably it's had the "bottom up" view for a very long time because I assume the Apple engineers who work on like malloc use it a lot. It's even weirder and more proprietary in the ways I mentioned above while also not having any sort of import feature, so I understand why nobody seems to know about it or steal design ideas from it, but it's slept on. Arguably I don't even think people should be using it for general-purpose use because it's ironically slow and laggy in ways that Perfetto definitely isn't, but it is exceptionally good at common tasks like "zoom into this region" or "let me quickly jump to the part of this call stack that is a problem" that I have not seen anywhere else.
- Thanks for the detailed comment!
> overwhelmingly it gets used because of their integration with the exceptionally simple JSON tracing format
So in the open source community maybe, but it's use in the Android organization in Google is ubiquitous. Obviously, people outside the company don't see this, but we do. And I think even outside, there are a fair number of people using it for Android/Linux related things.
> UI should just get split off into its own thing
By split off, do you mean from a "branding" perspective? Or like separate as its own technical entity? If the former, maybe a reasonable idea but I think rebranding now would lose a lot of the "name recognition" which comes with the Perfetto name.
If the latter, there are two problems as I see it: 1) The UI uses the trace processor as its "backend". And the trace processor is deeply integrated into the rest of Perfetto. 2) If it's split off, who maintains it?
> it's just very strange to me that the UI will always be showing things like "syscall trace" or "connect a device" when I am looking at GPU kernels or network spans
Only in the recording page right? At least from the timeline perspective, everything should be only related with your trace. And in practice, we've been working on the last year or so on "pluginizing" the UI - basically turning the UI into a modular set of components and separating the "core" of the UI (which doesn't know anything about Android or Chrome and reasons purely in terms of "tracks", "slices", "counters" etc).
So it's actually possible to just totally remove all the parts of the UI you don't care about by going around and turning off things on the "Plugins" page. Obviously, most people are not going to do that but maybe we can offer them a "one click" solution when they first open the UI to do so?
> because I get the impression that they don't even really particularly like supporting what everyone else is using it for.
This is not true, we actually really do like supporting it for other people. It's just that sometimes what we want to do for open source conflicts with what Google wants from us as a team in prioritisation. I actually talked about this in detail recently: https://lalitm.com/perfetto-oss-company-prio/
> Also, I repeat this a lot, but I think a lot of profiling tools could stand to learn things from Apple's Instruments.
At least from the Android system profiling level, we do look at Apple Instruments! And yes there are things we can learn from them! But I don't think the gap is as large as you suggest (see below).
> It's even weirder and more proprietary in the ways I mentioned above while also not having any sort of import feature
So this is one reason Apple Instruments is so good at what it does: it's a focused profilier helping you debug problems on Apple devices and so they can deeply bake that intelligence in the tool. With Perfetto, I think if you record a real Perfetto Android trace (instead of generating a JSON one) you do actually get a much more "intelligence" (even though it's not as much as Apple).
For a synthetic trace, it's very hard for us to offer the experience because we don't know the same "happy debugging paths": we have no idea how you want to look at the data. How are is the UI meant to know on a random trace what sort of "problems" the user is looking for?
Would love to hear your thoughts on this because it's not like it's a problem we're not aware of, it's more, we think it's a super hard problem with no easy solution.
> but it is exceptionally good at common tasks like "zoom into this region"
At least for this example, Perfetto has this feature: when zoomed out, click on a slice in an area you want to zoom to and then press "f". It wil snap zoom into that section
> or "let me quickly jump to the part of this call stack that is a problem"
I think we also have this but it's a few more clicks than I think we should have. Definitely something we should close the gap on!
- Thid is the kind of interractions I come to HN for.
- > So in the open source community maybe, but it's use in the Android organization in Google is ubiquitous.
Yes I know, I used to work on Android ;)
> By split off, do you mean from a "branding" perspective?
> And in practice, we've been working on the last year or so on "pluginizing" the UI - basically turning the UI into a modular set of components and separating the "core" of the UI (which doesn't know anything about Android or Chrome and reasons purely in terms of "tracks", "slices", "counters" etc).
Yeah this is what I mean ^
> It's just that sometimes what we want to do for open source conflicts with what Google wants from us as a team in prioritisation. I actually talked about this in detail recently: https://lalitm.com/perfetto-oss-company-prio/
Yeah this is basically exactly what I mean, in fact I am kind of impressed that you nailed it down so precisely. I actually ran into that very bug and saw it get resolved in real time. I think this is a really good sign.
> So this is one reason Apple Instruments is so good at what it does: it's a focused profilier helping you debug problems on Apple devices and so they can deeply bake that intelligence in the tool.
No I don't actually care about this part, I am mostly talking about usability for general workflows…
> At least for this example, Perfetto has this feature: when zoomed out, click on a slice in an area you want to zoom to and then press "f". It wil snap zoom into that section
…like this one. I learned about this shortcut but it doesn't actually work the way I like. "f" doesn't zoom far enough and it doesn't stack, so it will "focus" with the region as like a quarter of the screen. There's a bunch of other nitpicks I have, for example when I select a range it will immediately pop up the thing from the bottom that I invariably close until I actually want it, or that every time I open it the sidebar (that I never use) is open. Feature-wise, I still haven't figured out how I can do something like get an "activity view" (like the stack that shows how many tasks are active) across all tracks, or quickly select the region between two spans, or pin a whole process (rather than just a thread). I am sure that some of these are solved or I'm just holding it wrong but I feel like it's just harder to get what I want, especially since I can't really right-click anything which is what I typically do when looking for features. If it would help, I am of course happy to file bugs and also make simple fixes :)
- > Yes I know, I used to work on Android ;)
Ahhhh good to know :D
> If it would help, I am of course happy to file bugs and also make simple fixes :)
Please yes do file bugs! It's so useful to have these things tracked: I think you've already given several great pieces of feedback in your comment, it would be really nice to have this tracked.
Doubly so if you have screenshots/videos/descriptions of other profilers (e.g. instruments) and how they do things so we can learn from their UX as well!
And of course, if you're willing to contribute, we would love to have them! We have a decent contributor base today but it's something I want to continue growing and investing in over time!
> can do something like get an "activity view" (like the stack that shows how many tasks are active) across all tracks
I think you're asking for basically the same as what https://github.com/google/perfetto/issues/3463 is asking for if I'm not mistaken? That will do it per-group (i.e. per process for the JSON format). Or do you actually want something global across all processes? I think we could do that, maybe hidden behind a command?
> across all tracks, or quickly select the region between two spans
I think you're asking for https://github.com/google/perfetto/issues/154!
> pin a whole process (rather than just a thread)
Makes sense, please file a bug!
> especially since I can't really right-click anything which is what I typically do when looking for features
There are some philosophical differences in the Perfetto team about "right clicking" :) I'm pro having it as an additional discovery mechanism but others feel it's a sign of bad UI/UX. Some commentary from users might help break ties!
- Does anybody have advice on how to embed perfetto UI into local tool? I'm currently using the old catapult chrome trace viewer to visualise and inspect scheduler outputs but there are some shiny features in perfetto that would be great.
Background: My company designs machines that automate medical laboratory tests. Many applications have a fun scheduling problem at their core, think 'job shop' with a bunch of biology-enforced constraints.
To help design these systems our tool allows an engineer to (a) enter a 'recipe' and resource constraints of a hypothetical system (b) use our fancy scheduling engine to simulate the system, (c) output a 'trace' of how each piece of equipment is scheduled and (d) display some basic statistics.
Currently this is implemented as a single .html file - the GUI is vanilla js, the scheduler is cross-compiled to wasm and embedded and the output trace json is injected into an iframe containing chrome trace viewer.
Because the design process is quite iterative, a single button press to run the simulation and display the output is desirable.
I understand that perfetto has chosen not to support embedding, fair enough. plugins seem to require hosting/maintaining my own fork. Any other ideas?
- Perfetto does support embedding though I concede it's not as seamless as it was with chrome://tracing.
As with Chrome://tracing, you can put the UI inside an iframe and pass the trace to the UI via postMessage (see https://perfetto.dev/docs/visualization/deep-linking-to-perf...). There are quite a few people that do this: the big ones I'm aware of is the Rust language CI for performance (https://github.com/rust-lang/rustc-perf/issues/1857) and Flutter Devtools (https://github.com/flutter/devtools/pull/4386/files).
There's also an effort via contributions from some external folk to add more "proper" support for embedding (i.e. compiling Perfetto directly into a larger application, more like a library). That discussion is happening at https://github.com/google/perfetto/pull/2267 and the PRs spawned off it. We're hoping to have some more public documentation on this once that effort finishes up.
- oooh fantastic. Thanks! Exciting
My initial test looks pretty good, seems I will need to muck around a bit to get to "one click runs the simulation and displays the trace and stats" but that rust link seems to have clues.
It sure is pleasing to see perfetto handles long durations well - we work in hours and days not ns and us...
I don't suppose there is some supported way to inject macros or "ui automation" [1] into the iframe?
- > I don't suppose there is some supported way to inject macros or "ui automation" [1] into the iframe?
This is exactly what https://github.com/google/perfetto/issues/1342 is about :) It's not the highest priority issue but it is something I want to implement sooner than later.
Oh and separately you're right we should add support for also passing macros over the postMessage API. Will file a bug for this.
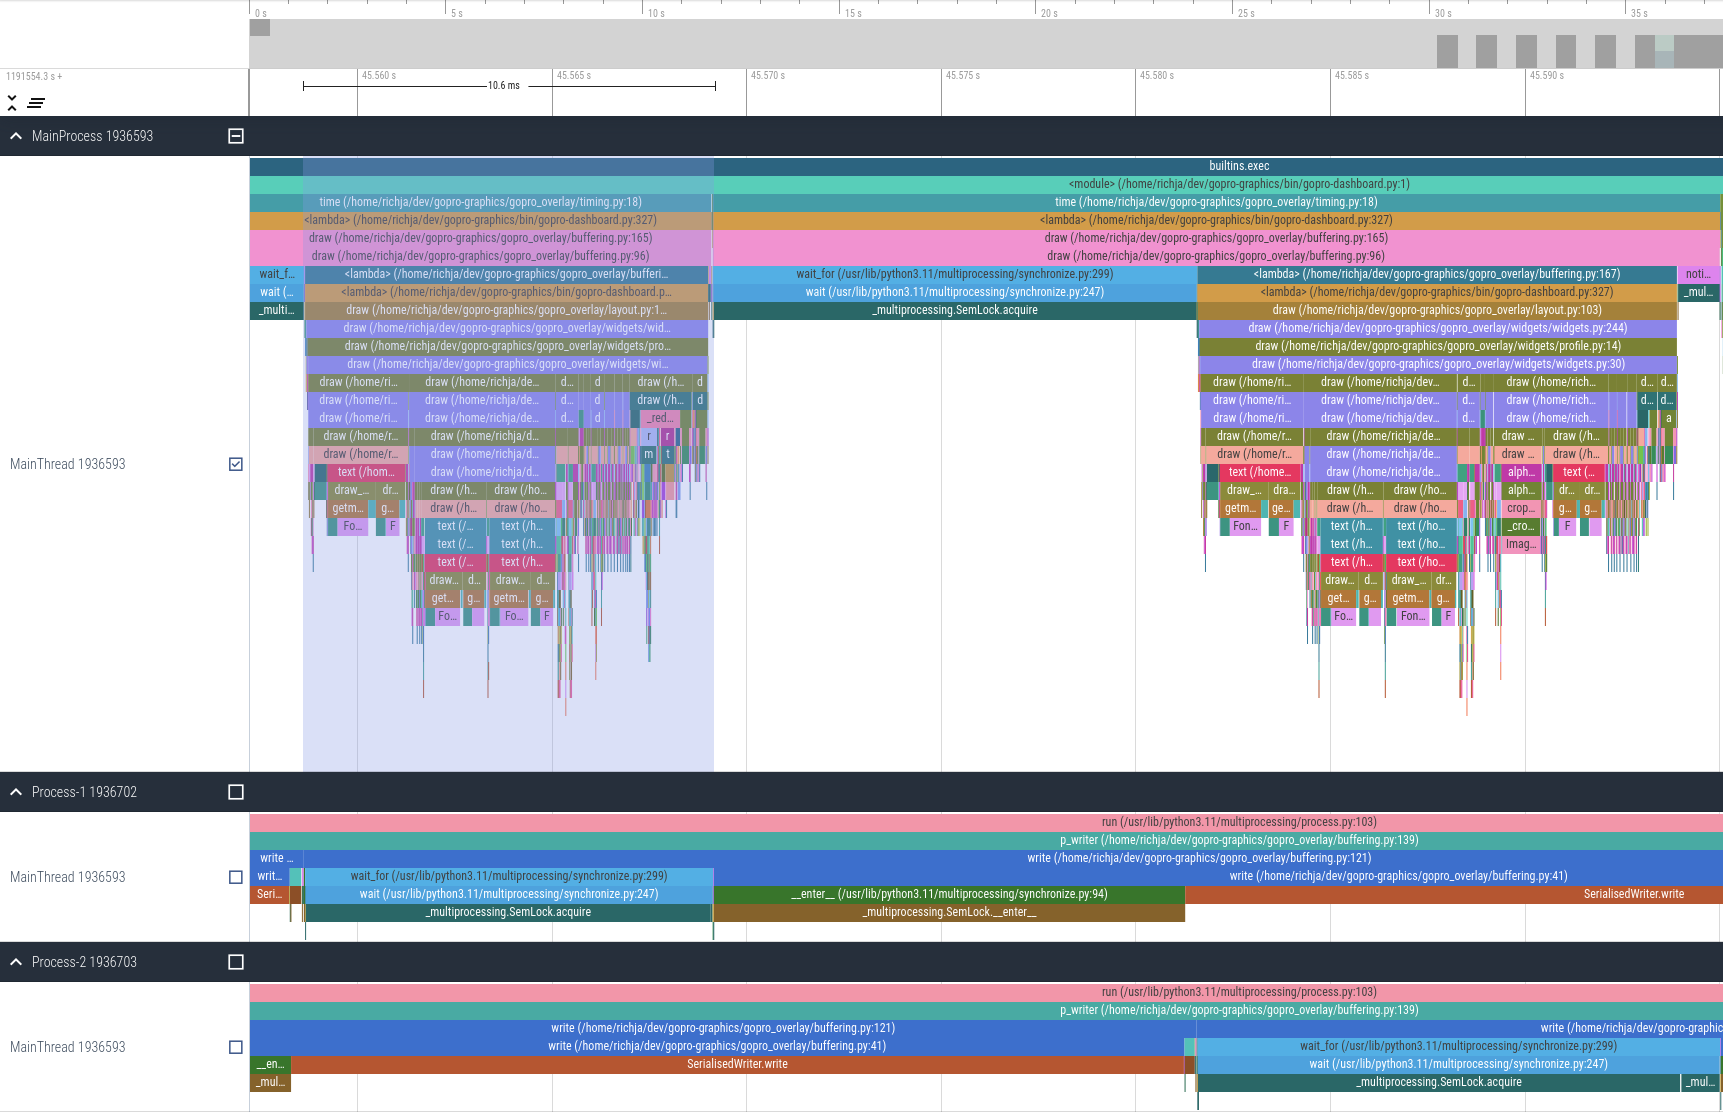
- Perfetto is so nice.
Viztracer is a super library to capture perfetto compatible output from Python.
It helped me find perf issues in literally minutes.
https://raw.githubusercontent.com/time4tea/gopro-dashboard-o...
- Glad to see that there's support for CPU sample flamegraphs in Perfetto now that's on par with Google's internal pprof visualizer as alluded to in the talk. Using the internal visualizer to share Windows ETW traces with colleagues was the primary motivation for developing [EtwToPprof](https://github.com/google/EtwToPprof). Now that perfetto supports this natively, I might look into developing EtwToPerfetto :-)
- Fun fact: Perfetto also gained support for the pprof format within the last month :)
It opens a special "aggregate flame graph" view of the profile since pprof does not preserve time information. But it works! We use it for visualizing aggregates across thousands of profiles in production!
- SQL interface for querying traces is the real killer feature though.
- This kind of thing always feels too slow to use. Every time I open my trace in it, it always lags and requires a few seconds to zoom in or zoom out.
- Please file bugs against us at https://github.com/google/perfetto/issues! We're always very interested in seeing traces which are hitting performance issues. We take them seriously and are responsive at fixing them (or at least explaining what makes it hard to fix).
As I note in the post, we optimize for the needs of Android/Chrome developers so we may not necessarily know about whatever condition you are hitting with your trace!
- How much overhead does the recording have?
I want to debug custom kernel filesystem issues on a 96 CPUs machine. My benchmark is building the Linux Kernel def config with make -j96. I have tried ftrace before but it's making everything 100x slower...
- > How much overhead does the recording have?
Very much a symptom of what you are trying to record! See below
> I have tried ftrace before but it's making everything 100x slower...
If ftrace is making things 100x slower, I'm not sure that Perfetto is going to help you very much: fundamentally, for kernel stuff, it uses ftrace under the hood!
- Something too complex; I fear I won't ever have enough time to try it and figure out how to apply it for it to be of any use for me.
I wish there was a simpler and quicker introduction into the tool's capabilities than an hour long video and a text article saying it's a swiss army knife that does a lot of things. I need 1 or a few glimpses into it, there's no need to cover every capability thoroughly, show just enough to have some general understanding of how it works and how to use it and how to solve some common problems with it.
- Go to https://ui.perfetto.dev/. On the left sidebar, under "Example traces", click "Open Android example".
For a simple example using your own data, save this as a file and open it via "Open trace file":
[ {"name": "Example 1", "ph": "X", "ts": 1, "dur": 1, "pid": 0, "tid": 0}, {"name": "Example 2", "ph": "X", "ts": 3, "dur": 2, "pid": 0, "tid": 0}, {"name": "Example 3", "ph": "X", "ts": 2, "dur": 1, "pid": 0, "tid": 1}, {"name": "Example 4", "ph": "X", "ts": 4, "dur": 2, "pid": 0, "tid": 1} ] - This talk was meant to be a comprehensive look into the tool for an audience familiar with performance and tracing (but not necessarily Perfetto and how it can be used on Linux).
If you're more looking for a short intro, I'd maybe suggest our docs website, specifically the page https://perfetto.dev/docs/getting-started/start-using-perfet...
For example:
* if you work in the Linux kernel, try https://perfetto.dev/docs/getting-started/start-using-perfet...
* If you're generally curious about performance or tracing try https://perfetto.dev/docs/getting-started/start-using-perfet...
There's also our quick starts which take you through "I just want to see the tool in action". Find the system tracing one at https://perfetto.dev/docs/getting-started/system-tracing
- That's just the nature of these tools though. For example, Windows has its own powerful ETW tracing framework, but using it for real profiling and debugging requires learning a lot about the tools: https://randomascii.wordpress.com/2015/09/24/etw-central/
161 points by todsacerdoti 3 months ago | 23 comments